Spatial data engineering / Flood exposure / Reproducible GIS
Wake County Building Exposure
A clear boundary. A traceable count.
A GIS engineering study that turns statewide building footprints and an archived FEMA flood layer into a reproducible county exposure inventory, with explicit spatial QA, building-level identifiers, and independently reconciled results.
From the county to the footprint.
01 / The question
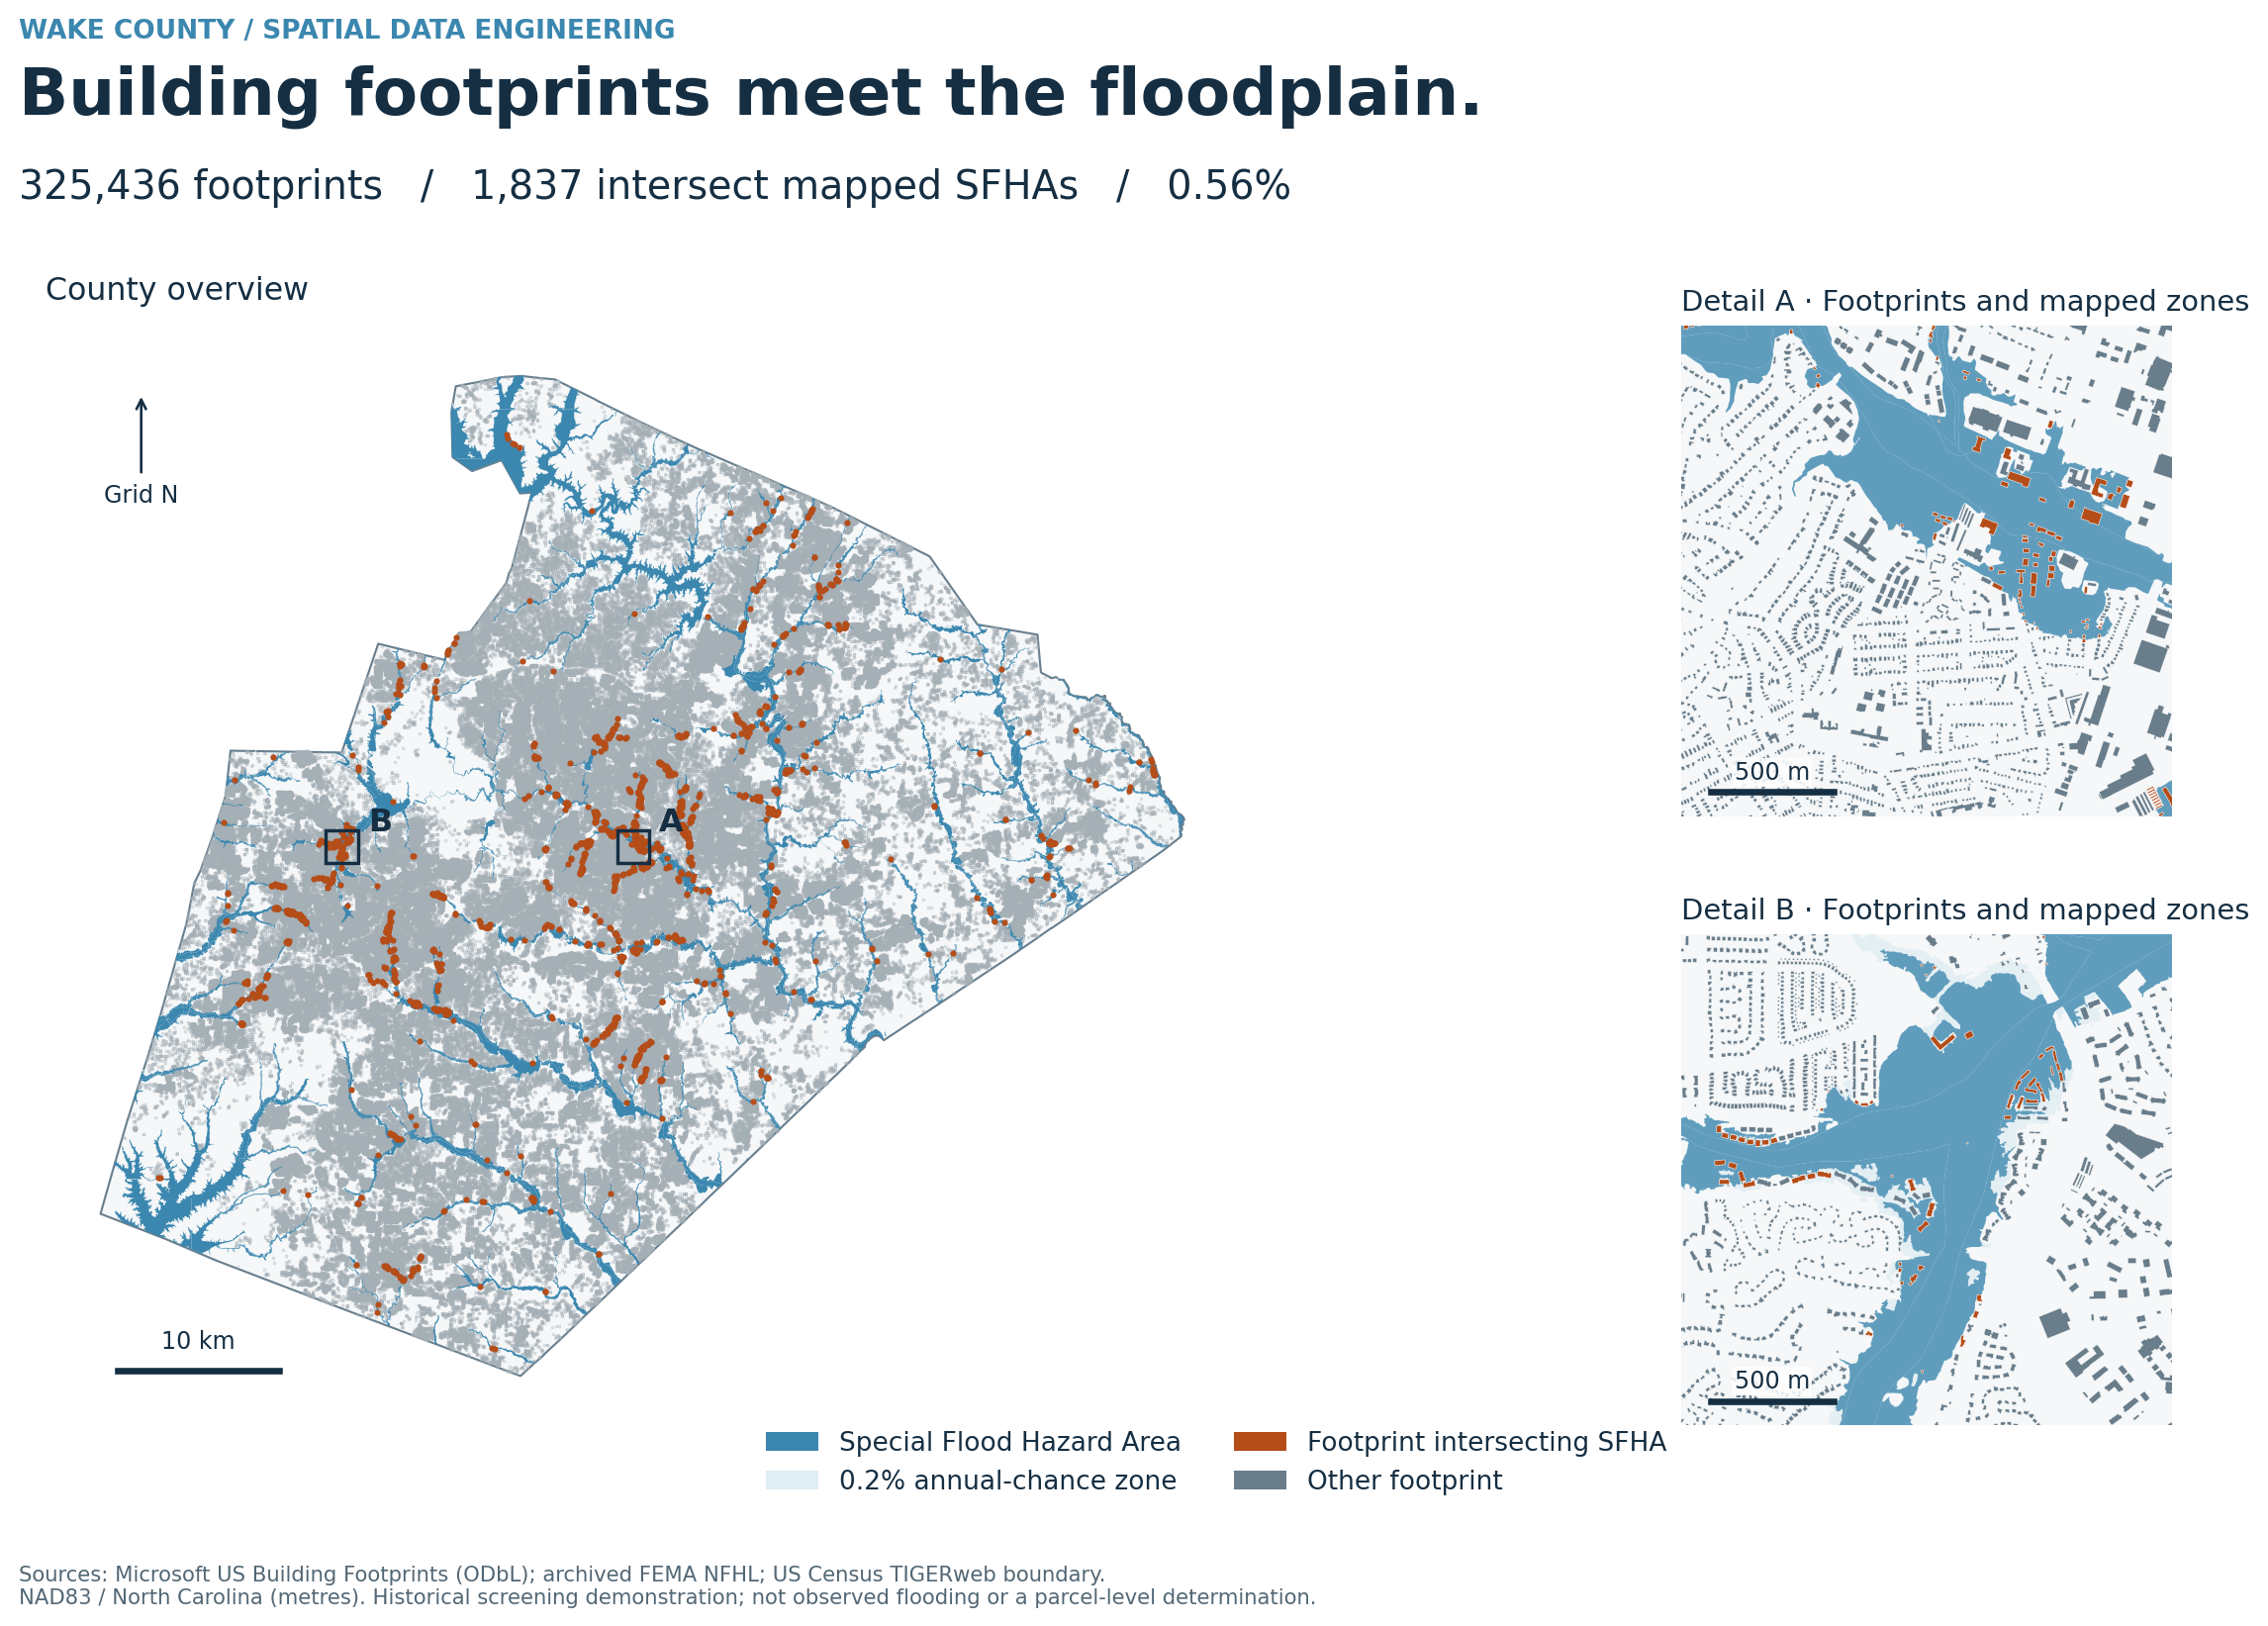
Which building footprints intersect the mapped floodplain?
Emergency-planning analysis starts with a consistent study population. This demonstration assigns footprints to Wake County, screens their geometry, and measures overlap with the Special Flood Hazard Areas in an archived FEMA extract. It demonstrates auditable spatial processing; it does not infer observed inundation, building damage, or population exposure.
My contributionDesigned and implemented the streaming footprint preparation, county assignment, geometry QA, flood-exposure analysis, independent validation, and publication maps.
02 / System walkthrough
From input to evidence.
The main stages of the implemented analytical workflow.
- 01
Stream the source
Read 4.68 million North Carolina footprints in a bounded-memory pass. Preserve source-based building identifiers and SHA-256 input fingerprints.
- 02
Define the county
Use the US Census Wake County boundary and an interior representative-point rule. Both numerator and denominator share the same geographic population.
- 03
Validate the geometry
Work in a local metric CRS, check polygon validity and exact duplicates, retain small footprints with QA flags, and record county-edge cases.
- 04
Measure exposure
Select FEMA SFHA_TF=T polygons, calculate positive-area intersections, and dissolve by building ID to prevent fragment or overlapping-zone double counting.
- 05
Reconcile and explain
Check exposure against a dissolved floodplain, reopen saved outputs, reconcile sampled areas, and publish an atlas and threshold-sensitivity analysis.
03 / Engineering decisions
Why the implementation matters.
One building, one count
Stable source IDs connect inputs, intersections and final flags. Multiple hazard polygons cannot create multiple exposed buildings from one footprint.
A local measurement system
NAD83 / North Carolina provides metre-based area and perimeter measurements. Full footprints are retained after county assignment; boundary-crossing cases remain visible in QA.
Small features stay inspectable
The workflow retains and flags 645 footprints under 30 m² rather than assuming every small structure is an error.
Sensitivity makes the rule visible
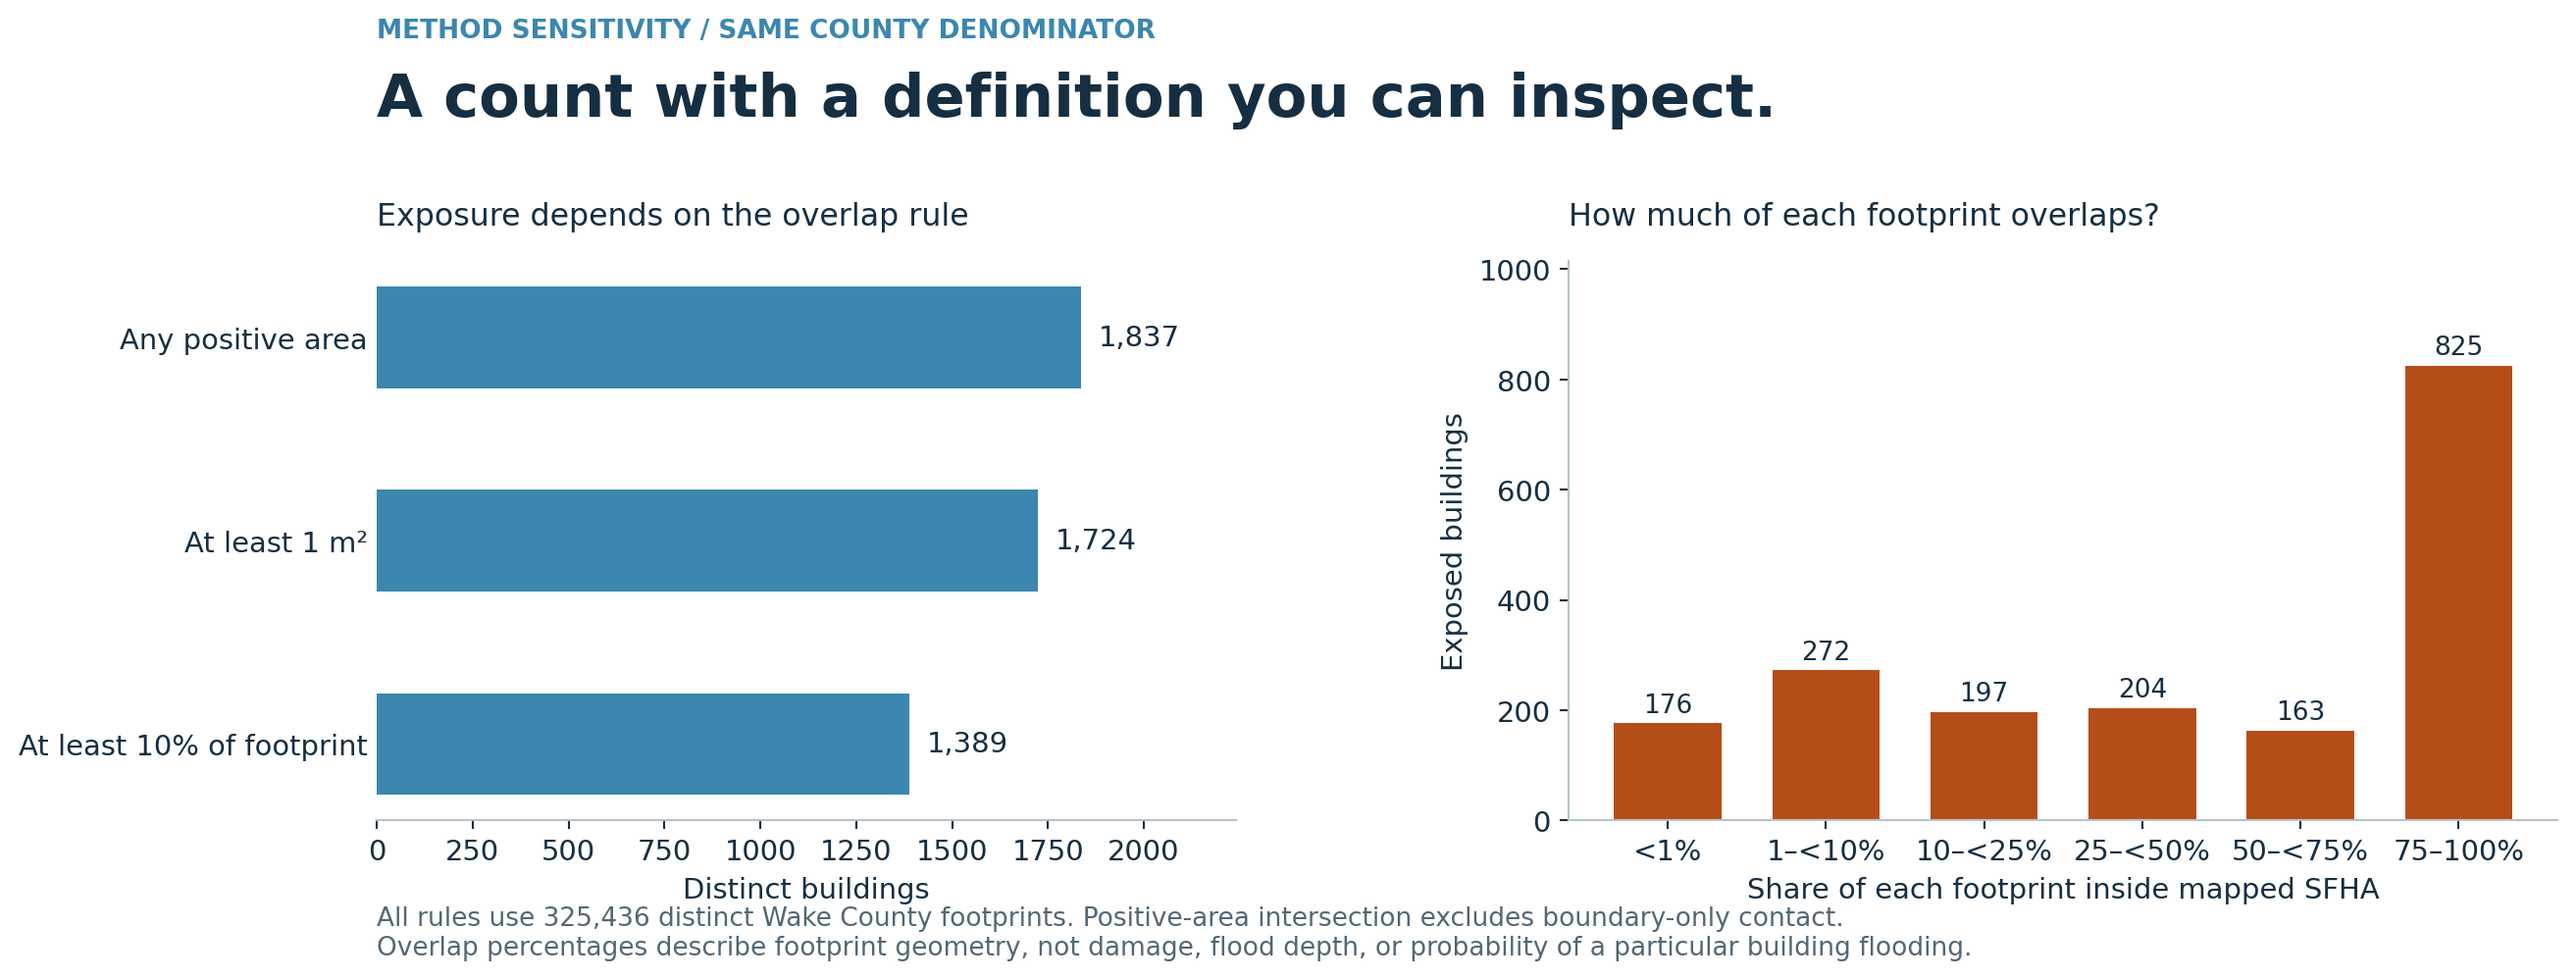
Any positive-area overlap is the primary screening rule. Alternative 1 m² and 10%-of-footprint thresholds show the effect of marginal intersections.
04 / Results & interpretation
What the spatial analysis showed.
Results come from the corrected and executed workflow, with a consistent county denominator and distinct building identifiers. Exposure means positive-area footprint overlap with archived mapped SFHAs.
County footprint inventory
325,436Distinct retained footprints assigned to Wake County using the documented interior-point rule.
Mapped SFHA intersection
1,8370.564% of the county footprint inventory. This is a geometric screening result, not a damage or flood-occurrence estimate.
Saved-output checks
ReconciledUnique IDs, valid geometry, county assignment, summary arithmetic and dissolved-hazard exposure flags passed. A deterministic sample of overlap areas was independently recalculated.
One population. Three definitions.
05 / Scope & limitations
Scope & limitations.
- Historical and mixed-vintage dataFootprints reflect the underlying imagery dates, not a current building census. The archived FEMA file records a July 2025 database modification date; effective dates of individual polygons and the original download provenance are not fully established. The county boundary is a January 2026 Census snapshot.
- Geometric exposure has a defined scopeFootprint intersection does not establish flood depth, occupancy, vulnerability, loss, or actual inundation. Buildings outside the selected SFHA can still face flood risk. Other mapped classifications are not interchangeable with the selected SFHA.
- QA is not surveyed ground truthComputational checks establish consistent processing. They do not independently establish footprint completeness or positional accuracy. Small overlaps and county-edge assignments are sensitive to source alignment. Five retained building representative points fall outside the archived FEMA polygon coverage and remain flagged in the spatial outputs.
- Independent flood demonstrationThis project was not commissioned by or affiliated with NC Emergency Management. Flood exposure is implemented here; surge, wildfire and tornado analysis remain possible extensions.
06 / Next iteration
Where I would take it next.
The next technical priorities for this project.
Strengthen source alignment
Compare footprints with a current authoritative inventory, verify regulatory hazard vintages, and review positional uncertainty at the floodplain edge.
Add decision context
Introduce building use, occupancy and vulnerability attributes with appropriate data provenance before drawing asset-priority conclusions.
Extend only with evidence
Add further hazards as separately validated analyses with explicit source, resolution and exposure definitions.
07 / Code & reproducibility
Explore the implementation.
The repository contains the corrected pipeline, synthetic contracts, saved-output validation, executed results companion, input fingerprints and publication figures.
- Streaming extraction from the original statewide footprint file; source hashes and pinned dependencies.
- Synthetic checks for overlapping zones, split intersections, boundary-only contact, slivers and geometry handling.
- Saved-output validation and a separate dissolved-hazard reconciliation.
- Aggregate results, FEMA zone inventory, QA counts and reproducible figure-generation code.
Maps and charts were regenerated from the corrected spatial outputs. Sources: Microsoft US Building Footprints (ODbL), archived FEMA NFHL and US Census TIGERweb. Detail windows are illustrative; no online basemap is required.