Data engineering / Event-time processing
NASA HTTP Log Analytics
Event time. Durable output. Tested recovery.
A reproducible Spark Structured Streaming pipeline that turns historical NASA web logs into final event-time counts. A full replay combines observable batch processing with strict parsing, watermark tests, and a verified checkpoint restart.
A full trace of processing behaviour
01 / The question
Can a streaming pipeline explain both its output and its behaviour?
Streaming correctness depends on more than a processing-rate chart. This project replays the July and August 1995 NASA web-server logs through a single checkpointed query. It follows each input into minute/status aggregates, then checks final counts against an independent Python implementation. Separate synthetic fixtures test the arrival patterns that a chronologically ordered performance replay does not exercise.
My contributionRebuilt the file replay, log parser, windowed aggregation, progress journal, and durable sink; designed independent count reconciliation and controlled late-data and restart tests.
02 / System walkthrough
From input to evidence.
The main stages of the implemented analytical workflow.
- 01
Prepare a controlled replay
Validate both source files and create 100,000-line chunks ordered by event time. Publish each chunk atomically and drain it before the next release.
- 02
Parse with explicit outcomes
Preserve timestamp offsets, accept legacy request formats, retain unknown byte counts as null, and count malformed records instead of silently discarding them.
- 03
Finalize event-time counts
Aggregate by one-minute window and HTTP status with a two-minute watermark. Append final windows through one native Parquet sink and one checkpoint.
- 04
Measure and reconcile
Journal progress after each drained file, resume from the same checkpoint, and compare every final minute/status count with an independent Python oracle.
03 / Engineering decisions
Why the implementation matters.
Use one durable query
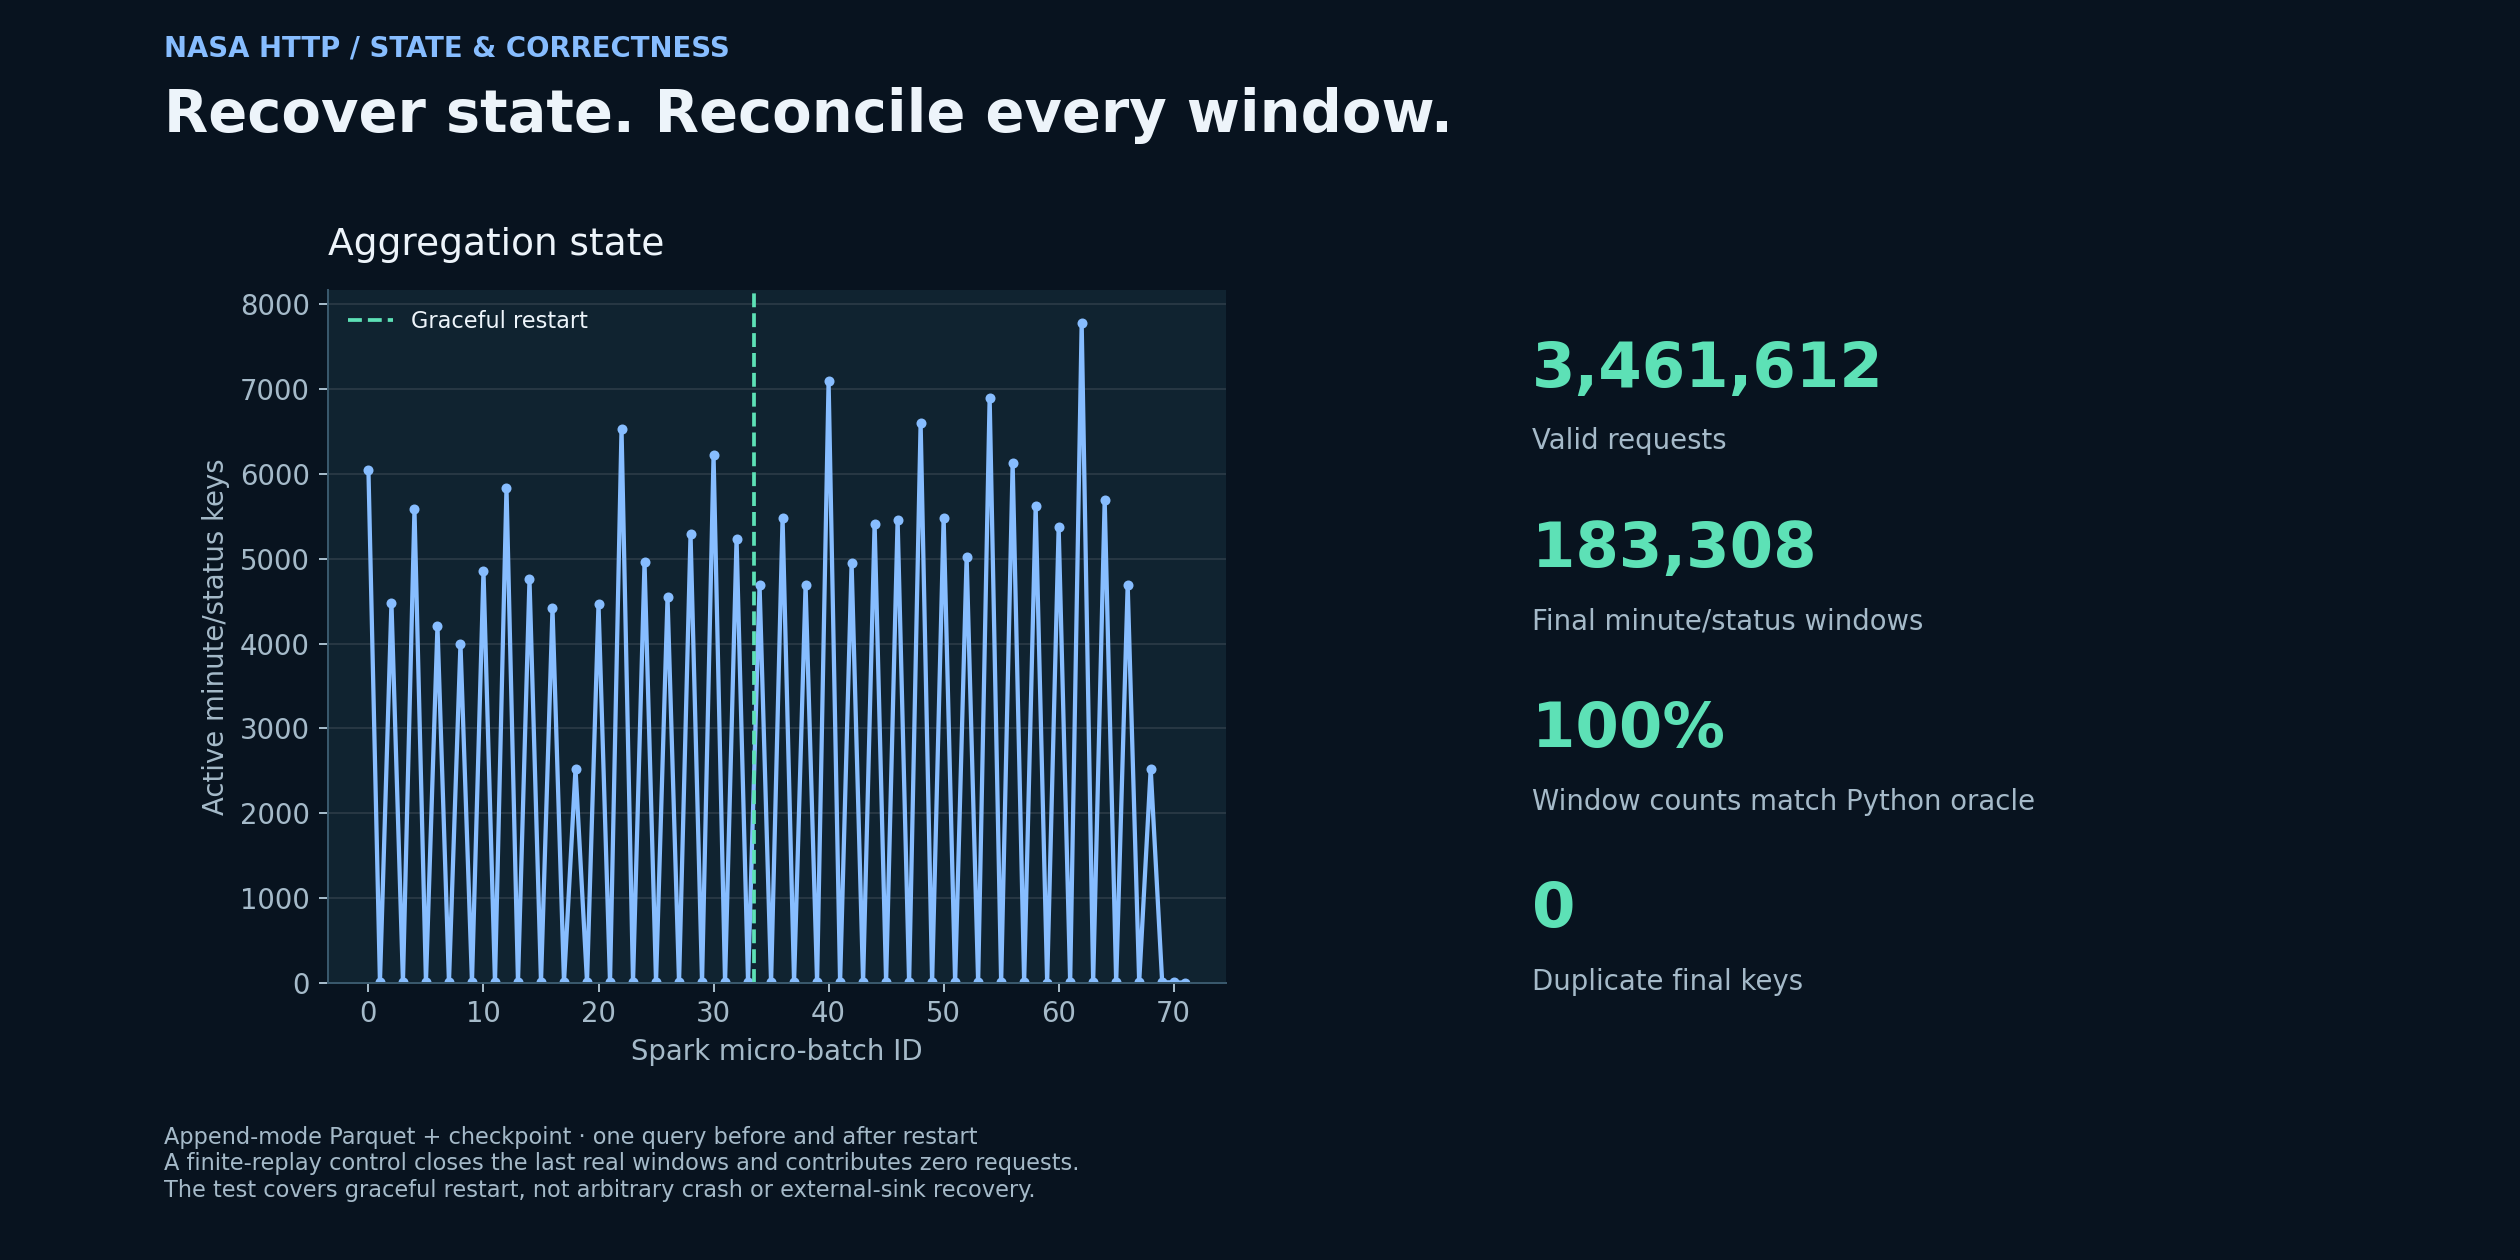
A single append-mode file sink avoids duplicated query work and ambiguous console-versus-file output. Finalised windows are written once under the tested checkpoint lifecycle.
Separate clocks and measurements
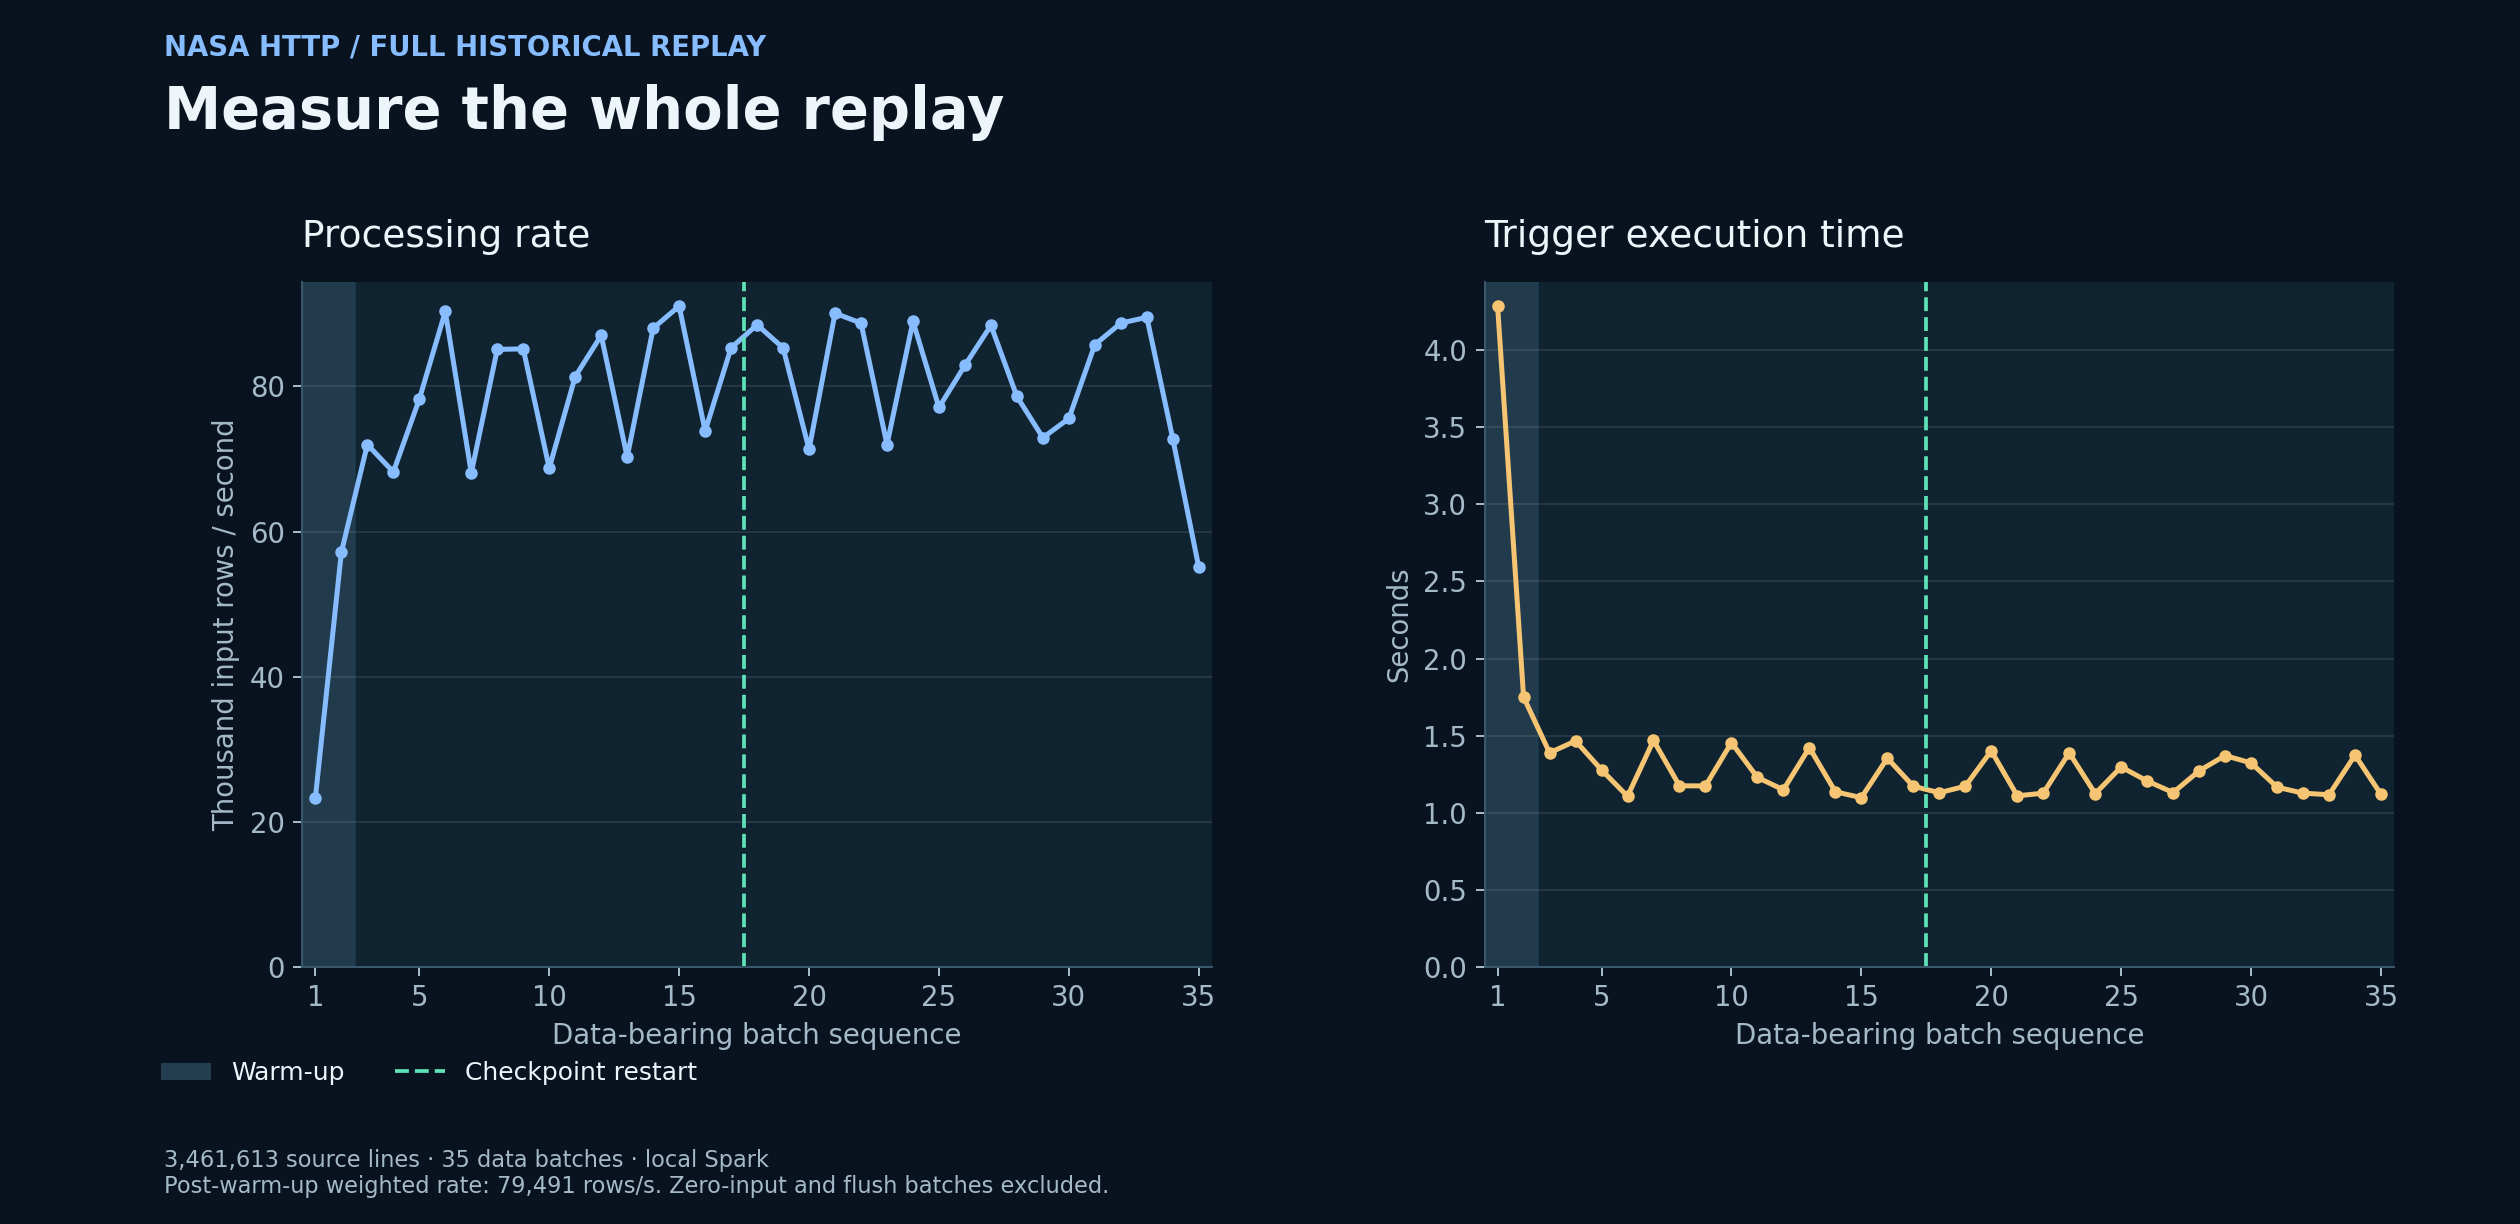
Historical event time controls windows; current trigger duration measures execution. Processing rate is not event-to-output latency or a production capacity guarantee.
Test adverse arrivals explicitly
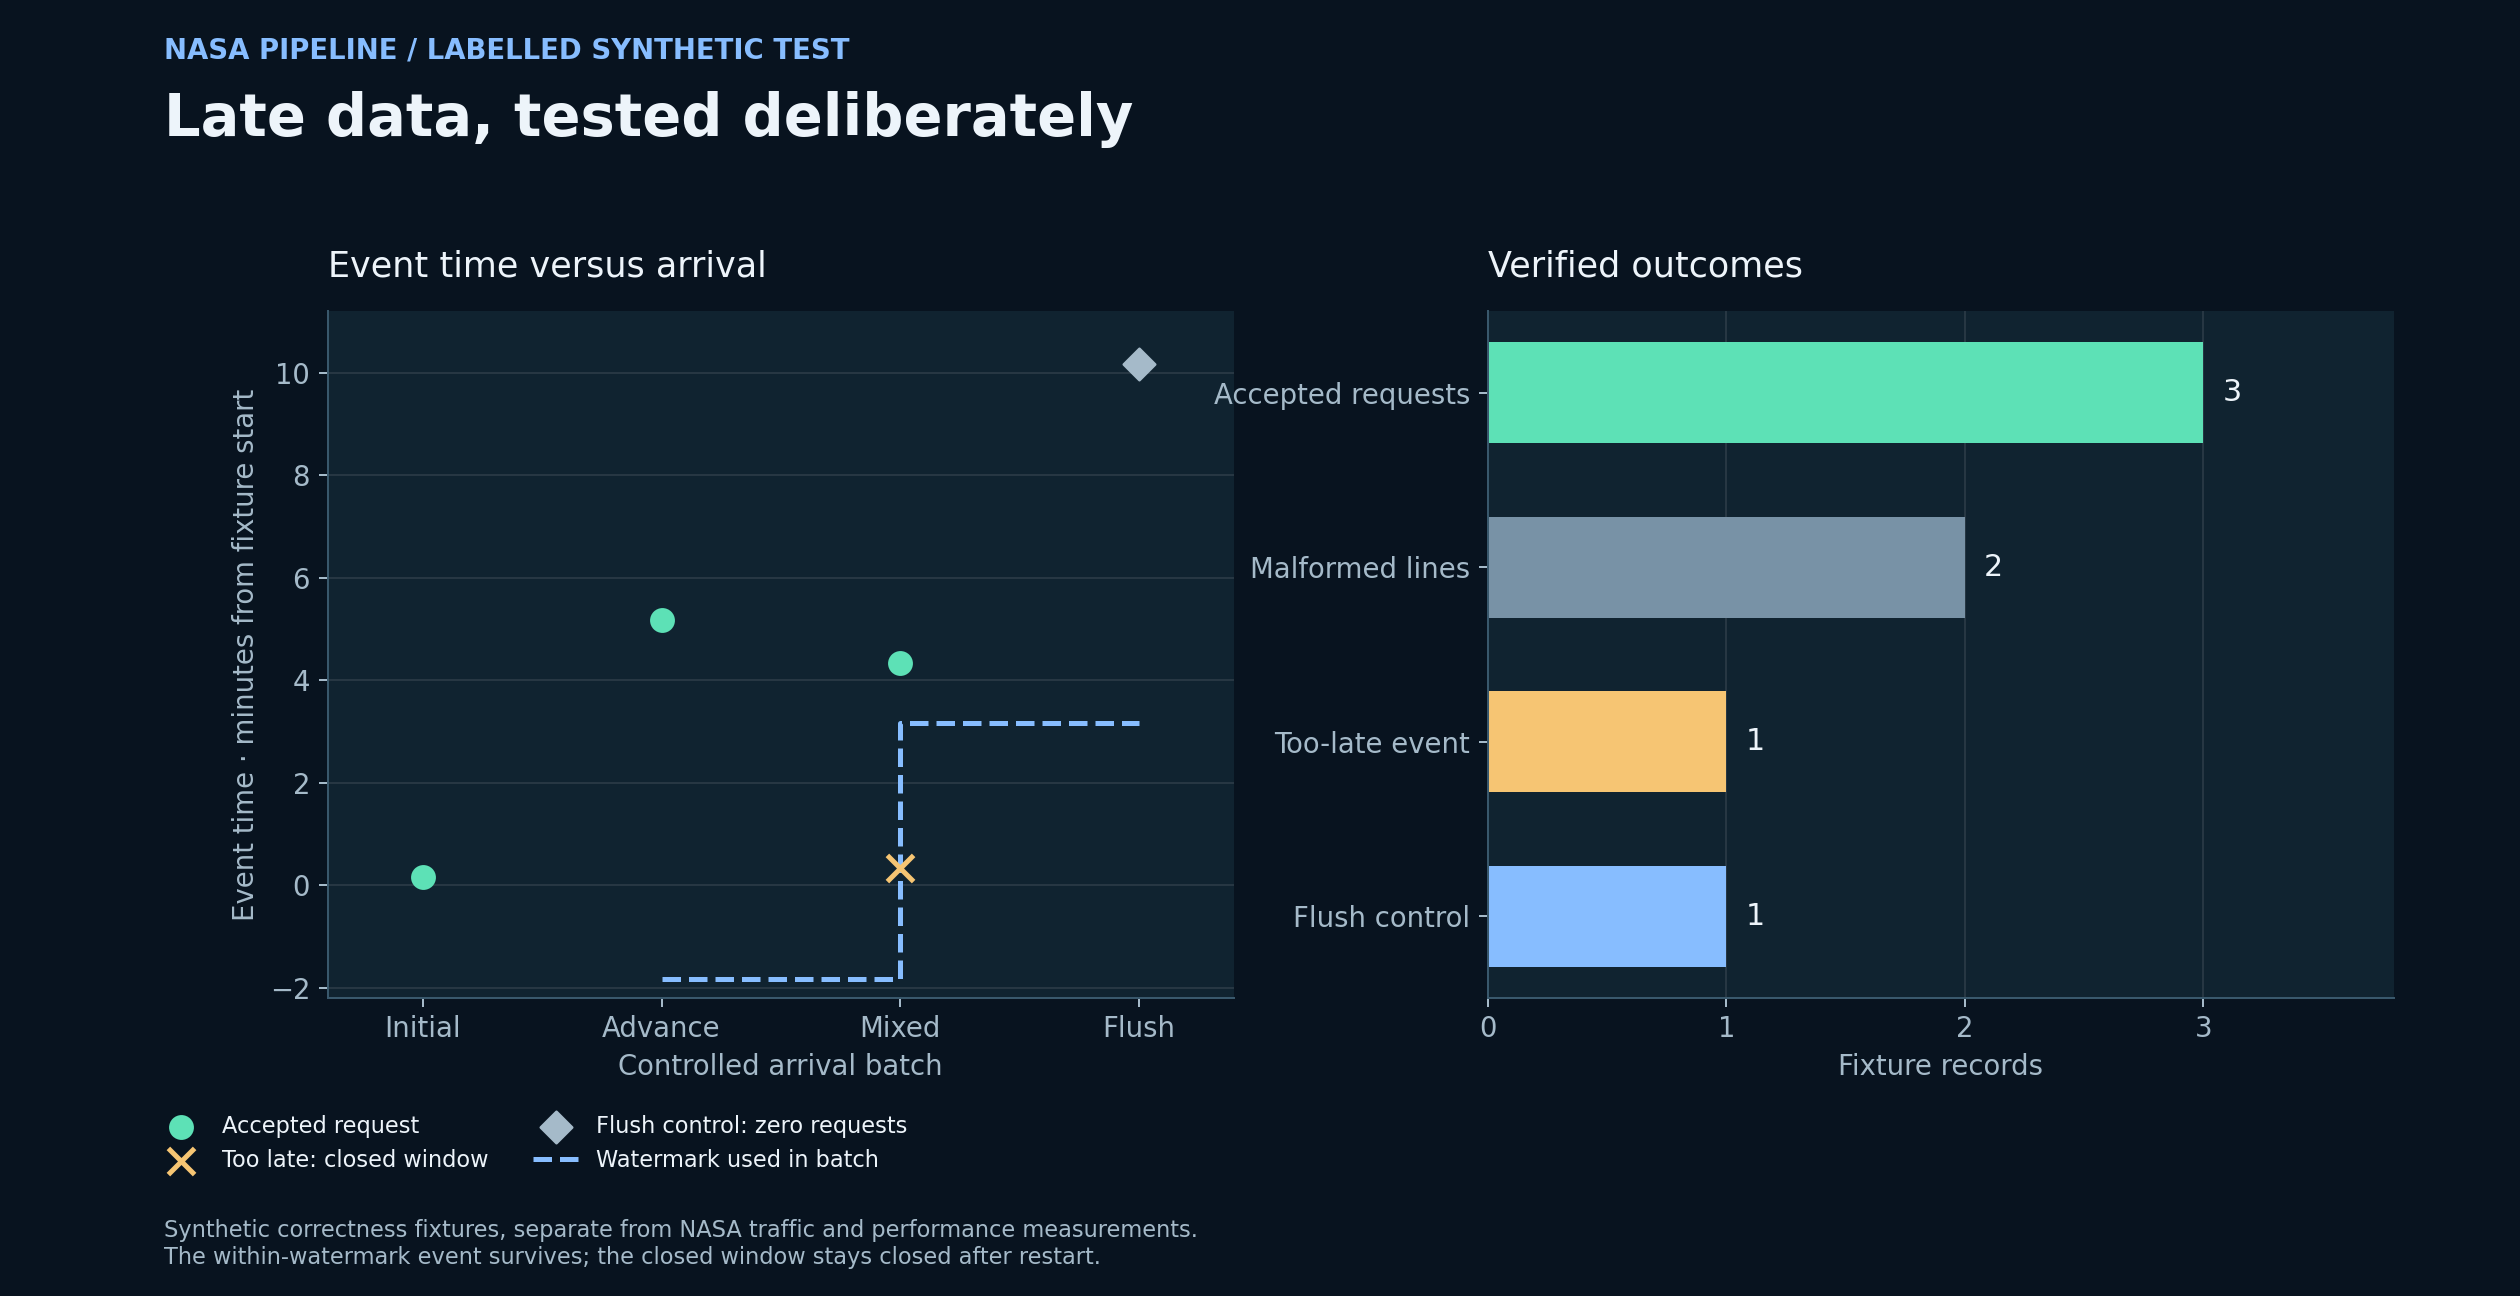
Labelled synthetic fixtures include within-watermark arrivals, a record for a closed window, malformed lines, and a graceful restart. These are kept separate from the NASA performance measurements.
04 / Results & interpretation
What the experiment showed.
Executed local Spark replay: 3,461,613 input lines across 35 data-bearing batches. Performance statistics exclude the first two batches, zero-input batches, and the synthetic finalisation control.
Full replay / correctness
3,461,612 requestsEvery final minute/status count matches the independent parser; no duplicate final window keys were found. One malformed source line was rejected.
Post-warm-up / processing
79,491 rows/sWeighted rate over 33 data-bearing batches: total input rows divided by their total trigger-execution time. This is a local historical replay measurement.
Synthetic contract tests
Late + recoveryThe within-watermark event was counted; the event for a closed window was dropped. Checkpoint restart preserved final counts without duplicate keys.
Recovery backed by output reconciliation
Correctness under controlled late arrivals
05 / Scope & limitations
Scope & limitations.
- Controlled backlog, not live trafficThe replay is sorted by event time and driven one file at a time. Throughput describes this local query and workload; it does not establish sustained production capacity or end-to-end latency.
- Watermark tradeoffAppend output delays finalisation until the watermark passes a window. A synthetic control closes the final windows of this bounded replay. Live streams need a separate idle-input and late-arrival policy.
- Recovery scopeThe tests cover a graceful stop and restart with the same source, schema, sink, and checkpoint. Abrupt crashes, corrupt checkpoints, schema migration, and external-sink failures were not injected.
- Historical data and privacyThe logs describe 1995 requests. Analysis is limited to general traffic patterns; host names and request paths are excluded from published outputs. Modern availability and threat-detection claims are outside scope.
06 / Next iteration
Where I would take it next.
The next technical priorities for this project.
Measure a live ingestion path
Add a rate-controlled producer or Kafka source and record wall-clock arrival-to-durable-output latency separately from processing rate.
Test failure modes
Inject process failures and sink interruptions, then verify recovery and idempotency under a declared failure model.
Tune under realistic arrivals
Compare watermark delays, batch limits, state footprint, and alerting policies across measured event-delay distributions.
07 / Code & reproducibility
Explore the implementation.
Explore the implementation, selected results, and technical documentation on GitHub.
- Corrected parser, ordered replay, and single checkpointed append query.
- Full batch metrics, parser outcomes, source/code hashes, and output reconciliation.
- Ten parser/progress tests plus executed synthetic late-data and graceful-restart contracts.
Figures regenerated from the full batch trace and clearly labelled synthetic correctness tests. Raw logs, host names, request paths, and private runtime/checkpoint files are not published.